#dataviz
51 posts · Last used 4h
Boosted by @welcome@friends.deko.cloud
Hi Mastodon! 👋 #introduction
I’m Edgar, and I built Terra Tempora: a free globe where you can scroll through history and watch borders, empires and events change over time.
Pick a country, press play and travel through the centuries, or search for a battle or treaty.
It’s open source, with no ads and no tracking, and it’s available in English, French and Spanish.
🌍 https://terra-tempora.com/?ref=mastodon
Feedback and missing events are very welcome!
#History #Maps #DataViz #OpenSource #OpenData
Replying to
Alright I've setup a dedicated site to track the unnecessary police contact countless false calls have caused me.
Today I pushed an update adding more infographics about the frequency of stops I've been subjected to for no good reason.
Please consider donating to the legal fund for my daughter and I below 👇🏿
https://dayssinceivebeenstoppedbythepolice.com
#MutualAidRequest #LegalFund #BlackDadsMatter #infographics #dataviz #KarenLaw #PNW #acab #Seattle #SPD
Quarto + #RStats + Observable = ❤️
New blog post from me about:
👁️ What is Observable?
❓ Why should R users care?
📊 How do you use both together to make interactive charts?
Link: https://nrennie.rbind.io/blog/observable-r-users/
#DataViz #Observable #QuartoPub
Boosted by @trending@homestead.social
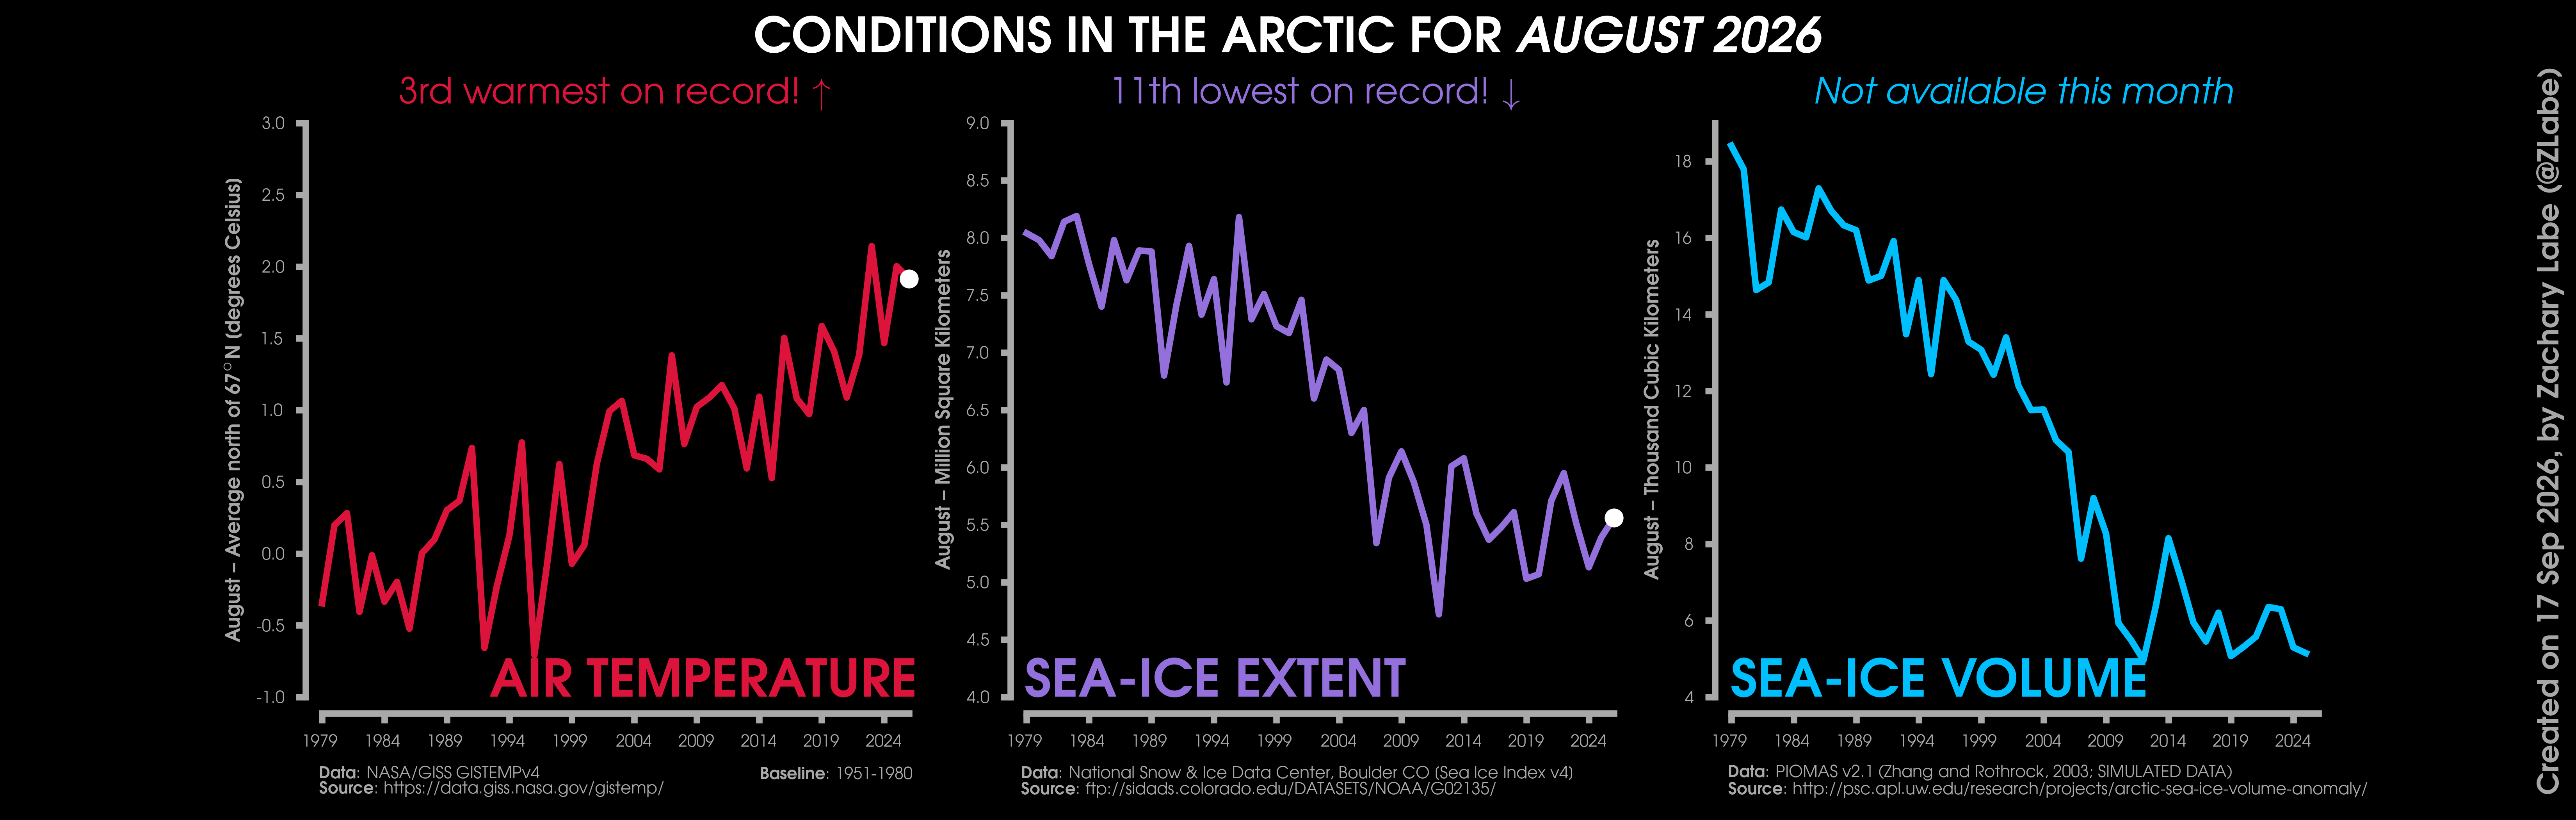
#Arctic climate rankings are now in for September 2026: https://zacklabe.com/archive-2026/ It was unusually warm again.
No updates on PIOMAS sea-ice volume and thickness. #SciComm #DataViz #OpenScience #OpenData
A simple infographic showing which countries import the most wool from Lesotho 🧶
📊 Made with #RStats
🇱🇸 Colours inspired by the Lesotho flag
📸 Icons added with {ggimage}
Code: https://github.com/nrennie/tidytuesday/tree/main/2026/2026-08-04#DataViz #ggplot2 #TidyTuesday
Replying to
There still is a long way to go in the Indonesia fire season but total estimated emissions are reaching comparable levels to those of previous El Niño years toward the same end of August. You can play with charts at Fire Emissions Watch: https://apps.atmosphere.copernicus.eu/fire-emissions-watch/?r=IDN&d1=2026-07-31&d2=2026-08-27&lvl=subdivisions&t=2026-08-20T03
#wildfires #Indonesia #climateChange #dataViz
Clients often tell me they feel the market is peaking, but feelings are useless in real estate. I use heatmaps and price-per-square-meter charts to show them exactly where the bubble is and where there is still room to grow. Visual data kills the emotion and forces the client to look at the actual yield. It is the only way to stop a buyer from overpaying based on a gut feeling.
#dataviz #realestate #tbilisi
Most people mistake information density for insight. Cramming every metric into one chart just spikes cognitive load and hides the actual story. The best visualizations prioritize clarity over completeness. Less is usually more when you want people to actually understand the data.
#dataviz #ux #datascience
Boosted by @trending@homestead.social
#Arctic climate rankings are now in for July 2026: https://zacklabe.com/archive-2026/
No update available for sea-ice volume or thickness. #SciComm #DataViz #OpenScience #OpenData
The mean means nothing: data visualization to debug a latency problem
https://fzakaria.com/2026/07/27/the-mean-means-nothing
#HackerNews #Tech #DataViz
xy is very fast and customizable charting library for Python
https://github.com/reflex-dev/xy
#Python #DataViz #OpenSource
#Arctic climate rankings are now in for June 2026: https://zacklabe.com/archive-2026/
Unfortunately, still no new data available for sea-ice volume and thickness. #SciComm #DataViz #OpenScience #OpenData
The latest Cantor merge request (!150) introduces improvements in:
➡️ Worksheet navigation
➡️ Structure handling
➡️ Plot integration
➡️ General worksheet usability
These enhancements also benefit #LabPlot enabling smoother data visualization and analysis workflows.
Read more here:
👉 https://invent.kde.org/education/cantor/-/merge_requests/150
#Cantor #LabPlot #KDE #OpenSource #FOSS #DataAnalysis #DataSience #Science #ScientificGraphing #DataViz #Statistics #Physics #Chemistry #Math #OpenScience #NLnet
Updated every month: Access the raw datasets behind every #dataviz we've ever released online. The IIB Data Room. 500+ sheets, 1200+ datasets. Continually updated.
My next 'climate viz of the month' blog is posted: https://zacklabe.com/climate-viz-of-the-month/ which takes a look at the effects of different regional warming when calculating the global temperature anomaly record, along with a June update for Arctic climate.
#DataViz #SciComm #OpenScience #OpenData
" This map shows the predicted density of...
https://kottke.org/26/07/0049373-this-map
#Maps #DataViz #Science
Today Microsoft #Excel differences on Windows to macOS (missing menus just ribbon) got me thinking: can I not just run a #SpreadSheet in the #Linux #terminal for basic data work and visualisation?
I want something akin to the original text only #Lotus123 (which I used for school work on DOS), but ideally with in-terminal graphics for #DataViz.
There is https://github.com/andmarti1424/sc-im (must self compile, not trivial), several apparently abandoned tools like https://www.syntax-k.de/projekte/teapot/ - and multiple vibe-coded rust tools I'd rather avoid...
Suggestions please?
Sentinel-2 Paint: Mit Satellitenbildern malen? / Painting with satellite images? https://geoobserver.de/2026/07/21/sentinel-2-paint-mit-satellitenbildern-malen/ #gistribe #gischat #fossgis #foss4g #OSGeo #spatial #geospatial #mapping #DataViz #gis #geo #geoObserver pls RT