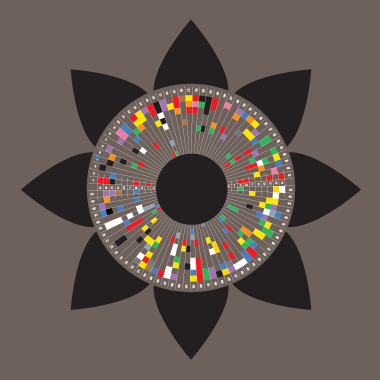
[#Infographic] Three years of Israeli genocide in Gaza (Euro-Med Human Rights Monitor, 2026-10-11)
https://www.euromedmonitor.org/en/article/7119
Graphic (jpg) 🔗
https://euromedmonitor.org/uploads/2026/10/en-three-genocide.jpg
#Gaza #palestine #EuroMedHumanRightsMonitor@palestine@lemmy.ml @palestine@fedibird.com
#infographic
4 posts · Last used 28d
The Villain Checklist – How to Create a “Great & Terrible” Villain
Career Authors
Memorable heroes require memorable villains. But what separates "great & terrible" villains from insipid ones? To help answer this question, we at Career Authors proudly present The Villain Checklist: Character Engineering for Writers
The Villain Checklist – How to Create a “Great & Terrible” Villain Brian Andrews…
https://careerauthors.com/the-villain-checklist-how-to-create-a-great-terrible-villain/
#Craft #characterengineering #infographic #Villains
Boosted by @cstross@wandering.shop
Why it can take 2 months to get an appointment in the UK’s National Health Service.
Useful & illuminating #infographic in the wild.
(by reddit user JetPac76)
NASA climate spiral, created by Mark SubbaRao. Data for 1880–2026.
It’s disheartening, I know. But it’s also a simple, powerful illustration of climate change over time.
Other versions in Celsius/Spanish, plus this version:
https://svs.gsfc.nasa.gov/5190
#Climate #ClimateChange #Science #NASA #Infographic #MarkSubbaRao
You've seen all posts